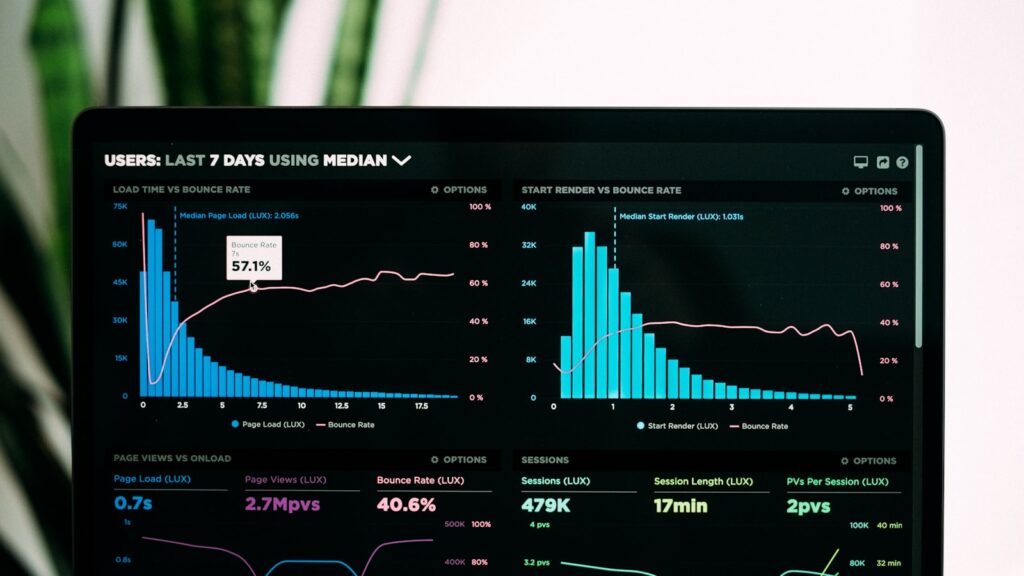
A dashboard is a collection of charts and lists pulled from your tasks. Lattica’s dashboards update live — no manual refresh, no scheduled sync, no separate BI tool.
Building a dashboard
Open Reports → New dashboard, give it a name, and start adding widgets. Each widget is a chart or list backed by a filter. The filter syntax is identical to view filters, so anything you can build in a view, you can put on a dashboard.
Widget types
- Number — single big number with a label and optional trend arrow. Good for KPIs: open bugs, tasks shipped this week, average time-to-close.
- Line chart — a metric over time. Great for showing burn-down, throughput, cycle time.
- Bar chart — comparison across categories. Tasks per assignee, bugs per component, work by sprint.
- Pie / donut — composition. Use sparingly; bars are usually clearer.
- Heatmap — distribution over two dimensions. Useful for finding bottlenecks (which assignee × which status has the most aging tasks).
- Task list — embed a filtered view directly. Same actions available as in a regular view.
Sharing
Dashboards have three visibility levels matching projects: Private, Team, Workspace. The URL is the dashboard — share it like any other Lattica link, and access is checked when the recipient opens it.
For external sharing (board reports, customer reviews), generate a read-only public link. Public dashboards refresh on a 15-minute cache; private ones are real-time.
Scheduled email
Any dashboard can be emailed on a schedule. Open Share → Email schedule, pick recipients, set cadence (daily, weekly, monthly), and choose a delivery time in the recipient’s timezone. The email contains a PNG snapshot and a link back to the live version.
Performance note
Dashboards with more than 20 widgets pulling from very large workspaces can take a few seconds to render. If you hit slow loads, the usual cause is a widget filtering on a relative date with no other constraints — narrow the filter to a project or team.